
Antelope Valley 2025 Market Recap
I am writing this a little later than planned, but between the holidays and the ridiculously long winter break that my daughter was on, I couldn’t find the time to sit down and get this done. So here we are! Better late than never.
I wanted to chart out how the market looked for both the Antelope Valley and Santa Clarita. If you want to see Santa Clarita stats, click here.
So let’s first take a look at prices, since that is what everyone is always talking about! What did prices do in 2025 in Palmdale and Lancaster? Did they tank like every buyer was hoping for?
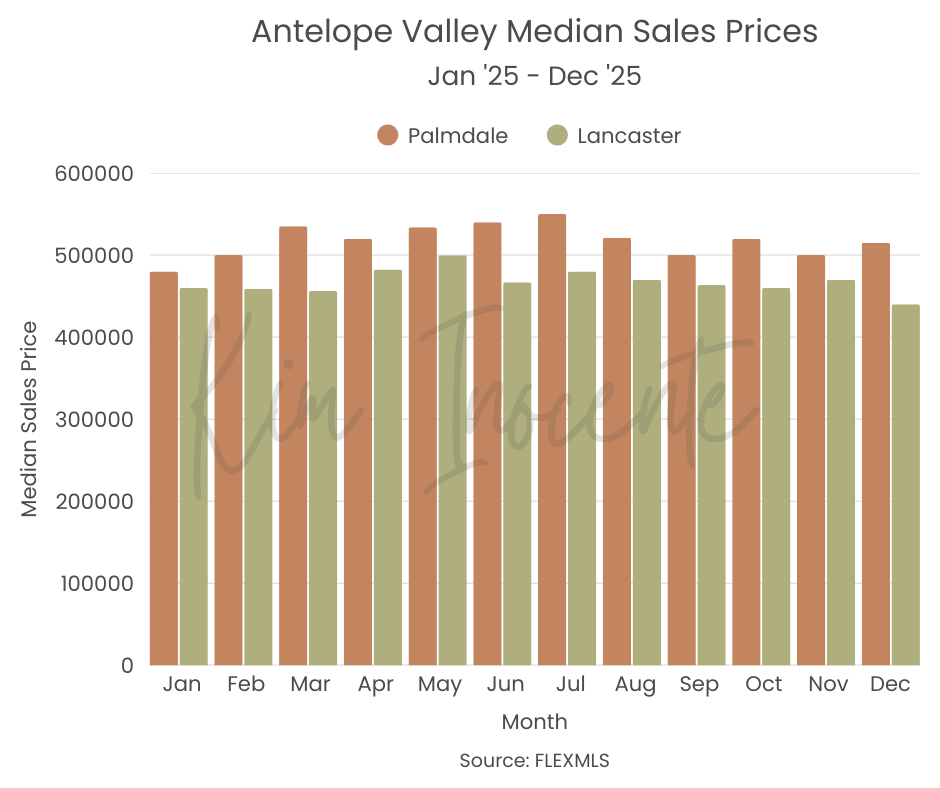
When I look at this graph, I see seasonal peaks, not price drops. Lancaster peaked in May with a median sales price of $499,700, while Palmdale peaked in July at $550,000. The rise and fall of prices is somewhat typical with the seasons. Spring and summer tend to be the busier months. Some buyers take their tax returns and decide to use them as a down payment on a home; kids are out of school, so it makes sense why most of the spring and summer months are the best performing.
We can also see the usual trend of Palmdale bringing in a higher price point and being less volatile than Lancaster. If we look at the beginning and end of the year, Palmdale began with a median sales price of $480,000 in January and ended with a median sales price of $515,000 in December. That is a $35,000 increase in the median sales price.
Now, when we compare Lancaster: in January, the median sales price was $460,000 and in December, Lancaster ended with a median sales price of $440,000. That is a $20,000 decrease in the median sales price.
Keep in mind, this is not a statement with certainty to say that prices are going up or down (nobody knows for sure), but it does give a little insight as to how both areas behave. I talk to hopeful homeowners all the time, and what I try to impress upon them is that big news outlets typically have a zoomed-out overview, but as you can see, the closer we look, the more nuance there is.
Now let’s talk about days on market. How many days is it taking to sell a home in Palmdale and Lancaster?
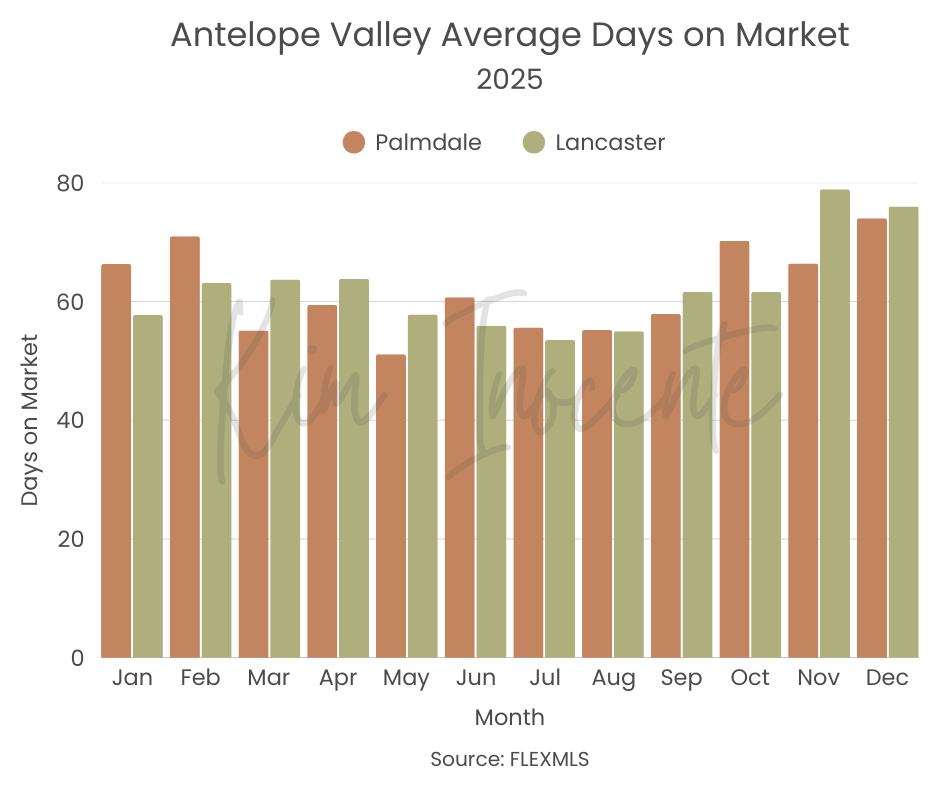
I know I am repeating myself here, but when I look at this, I mostly see seasonal highs and lows. We see homes selling faster in the spring and summer months and slower during fall and winter. When you compare this graph to the pricing graph, you can see how this lines up.
- Palmdale: The month homes were moving the quickest was May (51 days), which was the 4th highest month when the median sales price was $534,000. In contrast, the slowest month was December (74 days), which was the 8th highest month for Palmdale with a median sales price of $515,000.
- Lancaster: The best month in terms of days on market was July (53 days), which was the 3rd highest month for their median sales price that came in at $480,000. Now, the slowest month was November (80 days); however, it was not their worst month when we talk about median sales prices. In November, Lancaster had a median sales price of $470,000, which was their 4th highest month for 2025.
I can’t say for certain why Lancaster’s 4th best month was in November; however, my suspicion has to do with interest rates coming down as they did during 2025, but especially in the 4th quarter. This could be the reason that November did better for Lancaster than expected, especially being that their price point is more attainable for first-time buyers.
Lastly, let’s chat about listings vs. closings. This will give us insight into how the market is doing and what kind of competition buyers or sellers are facing.
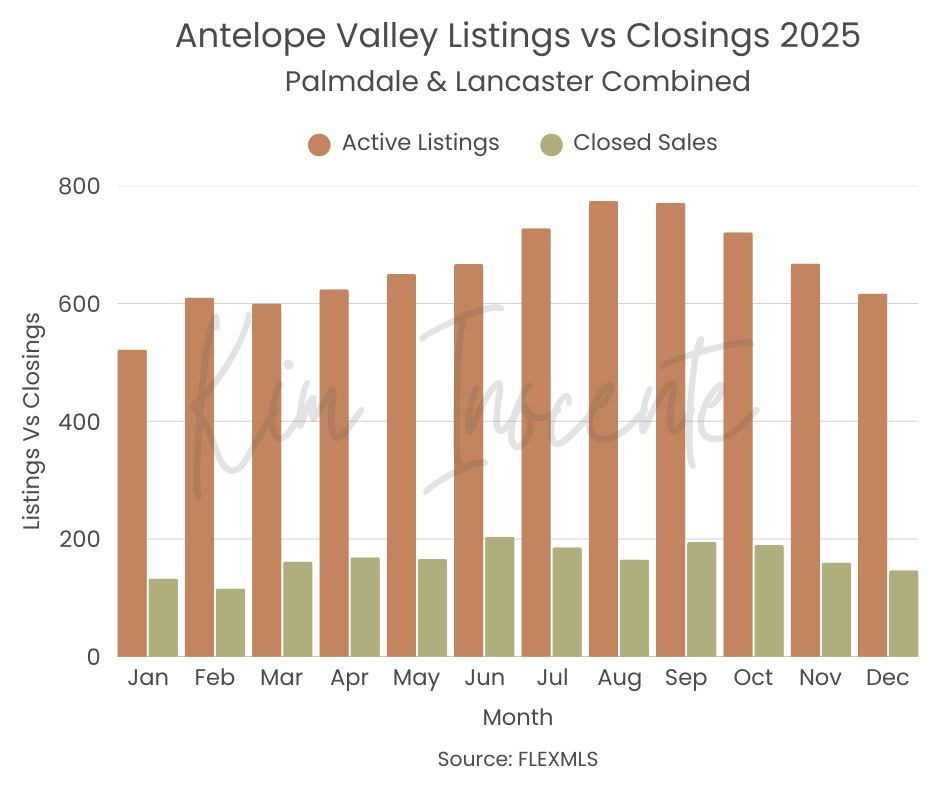
For this, I combined both Palmdale and Lancaster data to get a simple graph to see. From this, you can see that buyers have a lot of options and homes are sitting unsold (which is also shown by our days on market data) for a couple of months.
When I look at something like this, it tells me a couple of things. The first is that buyers have options. We are not in a seller’s market anymore. Homes are not flying off the shelves, and the beautiful thing for buyers is that they have time. They have time to look at a home and even come back to it a second time if they want to before writing an offer. I know that affordability is an issue, and I don’t know if/when that will change, but this is something that I feel like buyers don’t seem to have information on and it is a positive thing for them in this market.
This graph also tells me that sellers have competition, and just because you list your home for sale, it doesn’t mean it will sell. I check the MLS daily and look at homes that go into “expired” status, meaning that the contract with their agent has expired—aka the agent couldn’t sell the home. Often times when this happens, I can pinpoint why, and a lot of times it is either poor quality photos, staging, prep, or price.
Sellers need to understand that in this market, it takes real work to sell your home. Whenever I list a property, my clients get homework. It is not because I like to torture people, but because I want the photos of their home to stop a buyer from scrolling. It needs to stand out among all of the other competition. This means decluttering, painting your walls a neutral color, and even rearranging furniture to make your home look more presentable to buyers.
I was just telling someone the other day: there is a reason model homes exist. Think of the feeling you get when you walk into a model home; we need to do as much as we can to recreate that feeling for a buyer.
Final Thoughts
Now buyers, please do not get too excited and think this means you can come in and lowball every seller out there, because it doesn’t. As you can see from all of 2025, prices have been pretty stable. Just because Lancaster ended $20,000 below where they started does not indicate a trend, and it is hardly a crash. We are very much in a housing shortage and will likely be in one for a long while, which will keep pressure on prices.
Additionally, so many people are moving from the San Fernando Valley and beyond to Palmdale and Lancaster because it is so much more affordable. I talk to people doing that every day. In fact, I hosted three open houses over the last two weeks, and out of about 30 different groups I encountered (yes, it was that busy), only 3–4 of them were local to Palmdale and Lancaster. The rest were coming from places like Santa Clarita, DTLA, Glendale, Torrance, etc.
There is a big draw to the AV because it really is one of the few places where you can own a home for the price of a condo.
So that is all I have for you! Those were the highlights (in my opinion) of the 2025 Antelope Valley Real Estate Market. It will be interesting to see how 2026 pans out, and I will continue collecting data and charting it out for you to see.
If you have any questions or would like to discuss your options, my contact info is below.
Until next month!
Leave a Reply

I'm Kim! for over a decade I have helped buyers and sellers in the Antelope Valley and Santa Clarita reach their goals.
I'm so glad you're here
Hello!
My life behind the scenes as a real estate agent @hikiminocente
find me on
")


16544 Soledad Cyn Rd #129 Santa Clarita CA 91387
